library(tidyverse)
library(igraph)
library(tidygraph)
library(ggraph)Day 10
Advent of Code: Worked Solutions
Setup
Import libraries:
Disable scientific formatting when displaying large numbers:
options(scipen = 999)Read text input from file into a numeric vector:
input <- scan("../input/day10.txt")Part 1
Determine the differences between each jolt value ranked in order so that all are used, manually including the “0” starting point and the output rating of max(input) + 3. Compute the total number of 1, 2, and 3-jolt differences:
dist <- c(0, input, max(input) + 3) |>
  sort() |>
  diff() |>
  sort() |>
  rle()
Multiply the count of 1-jolt differences by the count of 3-jolt differences:
dist$lengths |>
  keep(dist$values %in% c(1, 3)) |>
  prod()
Part 2
Convert the list of adapters (including the “0” input and final output) into a graph.
g <- expand_grid(
  v1 = c(0, sort(input), max(input) + 3),
  v2 = c(0, sort(input), max(input) + 3)
) |>
  filter(between(v2 - v1, 1, 3)) |>
  graph_from_data_frame()
Get the list of all separators from the grap (vertices which disconnect the graph if removed):
sep <- g |>
as_undirected() |>
min_separators() |>
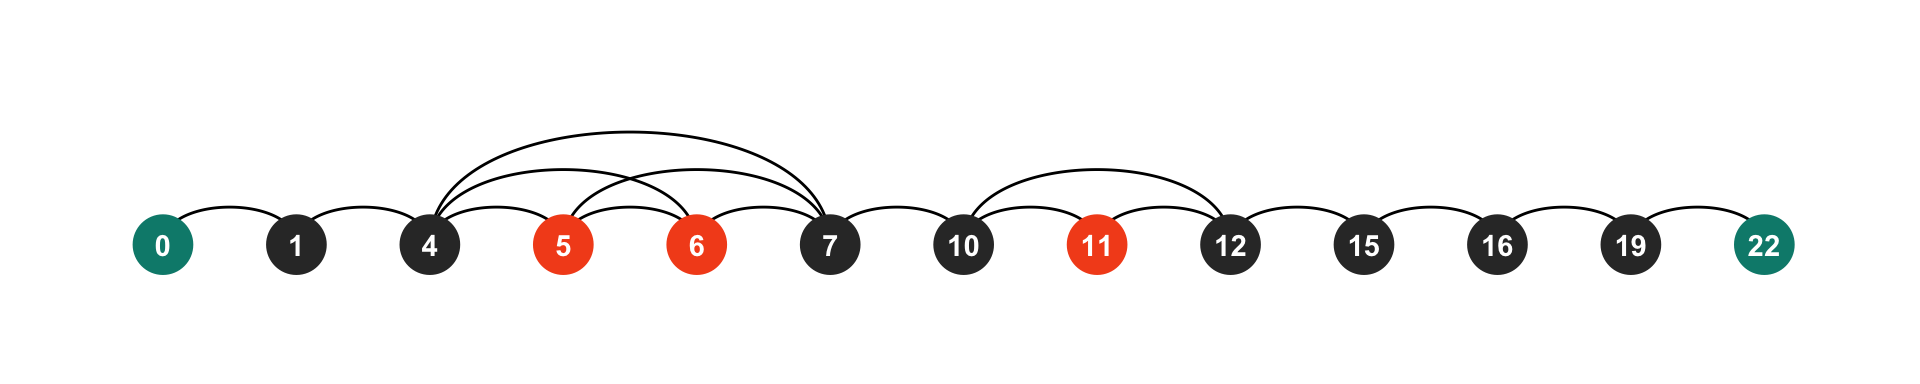
map_chr(names)The graph of the “small example” in the problem description is shown below, with ends colored green, separators black, and non-separators (nodes which can be individually removed without disconnecting the graph) red:
For each pair of separators in order, determine the number of possible paths between them. To get the final total count of paths, multiply the result of all pairs together:
sep <- sort(as.numeric(sep))

map2(c(0, sep), c(sep, max(input) + 3), \(v1, v2) {
  g |>
    all_simple_paths(
      as.character(v1),
      as.character(v2),
      mode = "out",
      cutoff = v2 - v1
    )
}) |>
  map_int(length) |>
  prod()