# Libraries
library(tidyverse)
library(unglue)
library(igraph)

# Read input from file
input <- read_lines("../input/day25.txt", skip_empty_rows = FALSE)Day 25
Advent of Code: Worked Solutions
Setup
Part 1
Convert text input to a graph:
wires <- input |>
  str_split(":? ") |>
  unlist() |>
  unique()

edges <- input |>
  unglue_data("{name}: {conn}") |>
  mutate(conn = str_split(conn, " ")) |>
  unnest_longer(conn) |>
  mutate(across(c(name, conn), ~ match(.x, wires))) |>
  pmap(\(name, conn) c(name, conn)) |>
  unlist()

g <- make_graph(edges, directed = FALSE)
Compute the betweenness of each edge and pull the three with the maximum values:
scores <- edge_betweenness(g)
idx <- scores |>
  sort(decreasing = TRUE) |>
  head(3) |>
  match(scores)
Plot for visual confirmation:
edge_colors <- E(g) |>
  as.numeric() |>
  case_match(idx ~ "blue", .default = "grey")

plot(g, vertex.size = 4, vertex.label = NA, edge.color = edge_colors)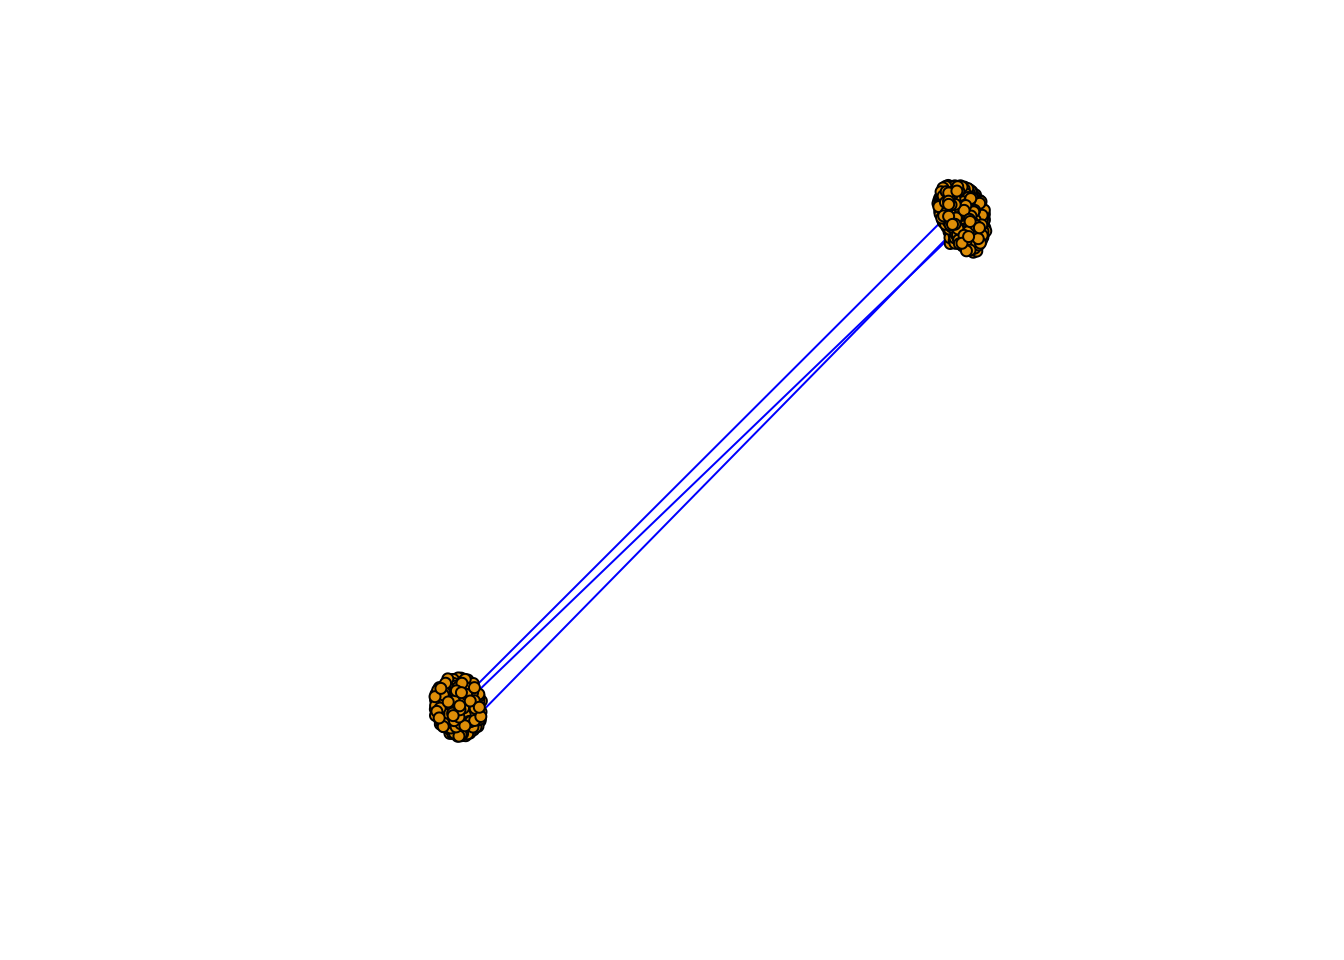
Remove the selected vertices from the graph, then calculate the product of the size of its two disconnected groups:
g |>
  delete_edges(idx) |>
  components() |>
  pluck("csize") |>
  prod()